
A 4-component model for determining friction losses in slurry pipelines was first described in 2001 by Wilson and Sellgren, with its latest revision being in 2014. In 2017, a paper was published by R Visintainer, J Furlan and G McCall II in which the existing method was put to the test with the goal of validating and calibrating the model. As a result, some slight changes to the existing equations were made in order to reach good agreement between the data set extracted from real experiments and the revised model. This report and the online calculator are both based on the aforementioned 2017 revision of the method.
The model consists of dividing the slurry in four basic components based on their particle size. After each individual component has been determined, the friction loss is calculated for each component using the most appropriate model for the corresponding particle size. Finally, the friction loss for each component is unified into one total friction loss for the entire slurry by using a weighted average.
The individual models used for corresponding components are:
While each model has demonstrated utility, industrial slurries often consist of a big array of particle sizes, which span more than one regime, hence the need for an integrated model.
As stated, the slurry is divided into four different fractions or components based on solids particle size, according to existing settling slurry flow models. The fractions are:
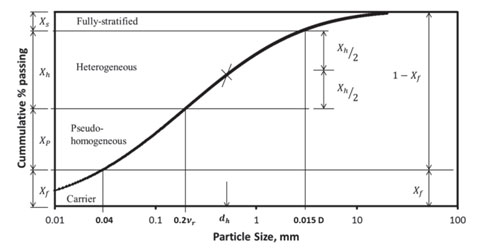
Includes all particles below 40 mm. These solids are assumed to “combine” with the liquid, only changing the density and dynamic viscosity of the resulting mixture. Friction losses for this fraction are modelled according to Darcy-Weisbach friction factor method.
Includes all particles above 40 mm and below 0.2*vr (mm) where vr is the relative kinematic viscosity of the carrier fluid to that of standard water (20°C). These solids are assumed to be fully supported by turbulence in the flow. Friction losses for this fraction are modelled according to the “Equivalent Liquid” model.
Includes all particles larger than the upper limit of Xp and below 0.015D, where D is the inner diameter of the pipe. Solids in this fraction are assumed to be supported by a combination of turbulence and contact forces between particles and the pipe wall. Friction losses for this fraction are modelled according to Wilson’s “V50” model.
Includes all particles above 0.015D. These particles are assumed to be supported by the contact forces transmitted from particles to the pipe wall. Friction losses for this fraction are modelled according to Wilson’s “Fully stratified” model.
Note that the fractions are defined relative to the total volume of particles (NOT the mixture), so that:

For reference, the following image shows a real life example of each component or fraction.
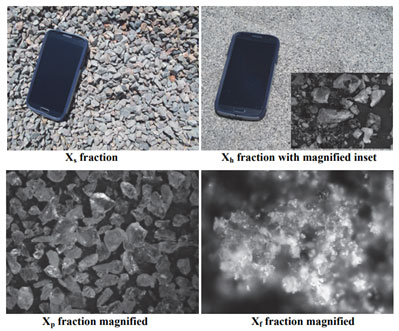
Where:
product with approx. 80% falling between 0.2 and 3 mm.
top size of approximately 12.5 mm
Finally, the following image shows a representation of the four component fractions and their corresponding particle sizes.
The model is not valid for velocities below the limit of stationary deposition, or in cases where the liquid or carrier fluid exhibits significant non-Newtonian properties. There might also be an upper limit of viscosities for which the model is valid, but it has not been determined yet.
Pump & Flow has developed a calculator to assist you in determining the pressure gradient in slurries using the four component method.
The validation of the model was carried out using a special slurry sampling device in which the slurry circulated in a loop while measurements were taken. The experiments were developed using two different pipe sizes for validation (8” and 4”), andan extensive description of the test setup can be found in the original 2017 paper.
The following tables show the tests that were carried out:
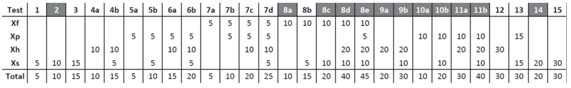
Table 1: Target percentages for volumetric concentrations. All tests were carried out in 8” pipe loop, highlighted tests repeated on 4” loop.
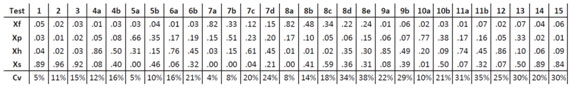
Table 2: Actual measured fraction content and volumetric concentration from the 8" tests.
And finally, the following graphs show the error in percentage between the measurements taken from the experiment, and the numbers calculated using the revised four component model.
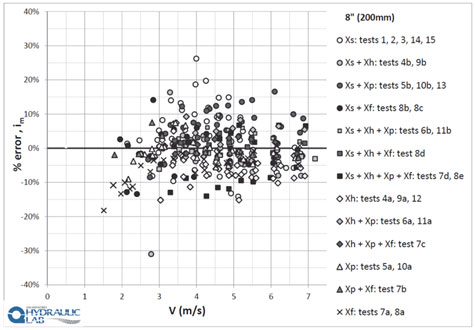
Image 3: Error percentage graph for 8" test.
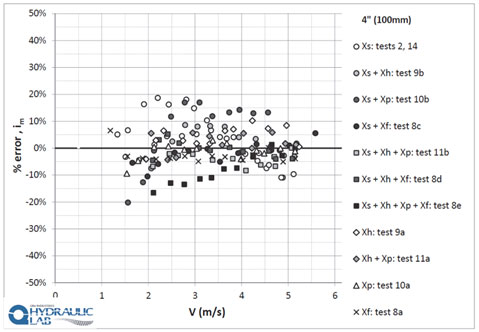
Image 4: Error percentage graph for 4" test.
Values for average error obtained in each testing case can be found in the conclusion below.
Conclusion:
A comprehensive and accurate data set spanning multiple flow regimes composed of 28 tests carried out in an 8” test loop, of which 12 were repeated in a 4” test loop, has been collected with the purpose of calibrating and validating the 4 component slurry model.
The revised model provided an average relative error of 5.3% for the 8” pipe and 5.4% for the 4” pipe, proving its validity for a wide range of pipe sizes and slurry compositions.
Check out our other related articles and calculators!
We aim to provide responsive service. Please contact us and
we will do our best to address your query: